Department of Economics |
 People
| NEWS & MEDIA |
MEDIA
State of the Pakistan Economy
Growth, Jobs, Welfare and Macro Policy in Pakistan
in 2020
Growth, Jobs, Welfare and Macro Policy in Pakistan
Annual GDP Growth 2020
The Lahore School of Economics macro model for the Pakistan economy estimates that GDP growth over the calendar year 2020, has been a contraction of -1.5 percentage points. The Covid 19 pandemic, intermittent lockdowns and openings, and hysteresis, have taken their toll. This estimate is based on observing four quarters of economic activity, from January to December 2020. As such this estimate of GDP growth is comparable to the IMF’s estimate for Pakistan, made mid 2020, of a contraction in GDP growth of -0.5 percentage points. |
But for us at the Lahore School’s Modelling Lab, the point of an estimate for the calendar year 2020, is not just that it makes Pakistan’s GDP growth estimates comparable to those of other countries, as standard global practice.
But that estimating GDP growth for the four quarters of 2020, gives a very good analysis of the evolution of the pandemic – its impact on the economy, on the jobs and welfare of the people.
Quarterly GDP Growth
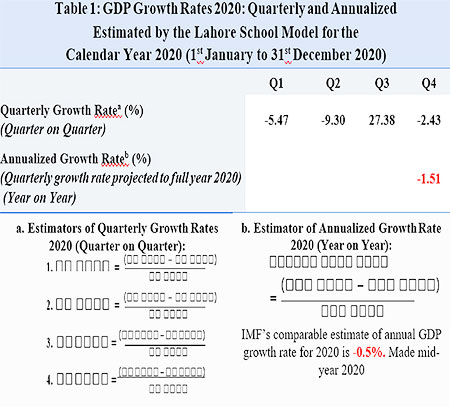
Table 1 gives the quarterly estimates for GDP growth for the calendar year 2020, January to December. These are quarter on quarter growth rates, in keeping with methodology established by multilateral estimates.
The first quarter for 2020, running January to March, saw a shutdown at the tail end, on 15th March. But even the tail end shutdown of 15 days, hit the industrial and services sectors hard. So, in Q1 2020, GDP growth contracted by -5.5 percentage points.
Q2 2020, running from April to June, bore the brunt of the shutdown, again largely in the industrial and services sectors. GDP growth contracted by -9.3 percentage points.
The shutdowns eased, and tapered off in Q3 2020, running from July to September. GDP growth recovered. Since the estimation is quarter on quarter, Q3’s increasing GDP output, compared to falling output in Q2, has a very high growth rate of 27.4 percentage points.
Q4 2020, finishing off the year from October to December, saw positive growth of output for the first two months, but a tapering off of output in December. Giving a contraction in GDP of -2.4 percentage points.
So, the pandemic hit the economy in Q1 2020. Blazed over Q2. Q3 saw a major recovery. With a tapering again in Q4.
Giving an annualized GDP growth rate of -1.5 percentage points.
Methodology
Sectoral Impact gives Supply Shocks
The quarterly and annualized changes in GDP growth over 2020 are given by a series of supply cum demand shocks to the baseline economy.
The supply shock is based on a mapping of sectoral shutdowns, and tapered openings, giving output lost. An output gap. Since there has been no economy wide survey of shutdowns, these have been approximated based on days of shutdowns across sectors.
In 2020, the agricultural sector comprised 19% of GDP. Industry 20%. Services 60%.
The shutdowns did not affect the agricultural sector. Were borne by (i) the industrial sector and (ii) the services sector.
(i) The industrial sector lost approximately -6% of its output in Q1. This loss increased to -23% in Q2. Then tapered off to -1% in Q3. Returning to full output in Q4.
Within the industrial sector, manufacturing and construction were hit primarily. Leaving out energy.
The large-scale manufacturing sector bore the brunt of the shutdown, rising to 30% of its output in Q2. Before tapering off in Q3. Small scale manufacturing loss in output peaked at 15%. As did the slaughtering industry.
Construction was the second major industry to be hit by the shutdowns. Its output loss peaking at -37% in Q2. Before tapering off in Q3.
(ii) The services sector lost approximately -5% of its output in Q1. This loss rising to -18% in Q2. Before tapering off to -2% in Q3. And returning to full output in Q4.
In the services sector, trade, transport and communication, and general services were hit by the shutdowns. Leaving out finance, housing services and government.
Transport and general services bore the brunt of the shutdowns. Transport’s loss in output peaked at -23% in Q2, before tapering off in Q3. General services loss in output peaked at near half of output in Q2. Trade loss peaked at -15% of output.
(iii) Total sectoral loss in output comes out at 4% in Q1, 16% in Q2, tapering off to 2% in Q3, and returning to full output by Q4.
Given these recoveries, the model estimates no hysteresis in sectoral output by years end 2020.
The model then estimates the supply cum demand shock to the economyThe sectoral supply shock to output and income then gives a demand shock.
The model takes the baseline economy in 2019, and subjects it to these supply cum demand shocks.
Which gives the quarterly and annualized changes in GDP growth over 2020.
Pakistan had a quarterly GDP of $69 billion in Q4 of 2019. Consumption accounted for $51 billion. The model estimates a two-stage shock. A supply shock of the shutdown, followed by a demand shock. Which drove consumption down by near $3 billion. Investment down by a half billion USDs. The current account deficit rose by -0.1 billion. Giving the Q1 contraction of -5.5 percentage points in GDP.
In Q2, the supply cum demand shock kicked in more. Consumption dropped by another $4 billion. Investment dropped by another $1 billion. But the current account deficit narrowed by $0.3 billion. Which overall worsened the Q2 contraction to -9.3 percentage points.
In Q3, the supply cum demand shock tapered off, Consumption rose by $12 billion. Raising investment by a billion and half USDs. While the current account swung into a surplus of $0.8 billion. Bouyed up by a remittance windfall effect. Giving Q3 a very high positive GDP growth rate of +27.4 percentage points. Albeit coming from a quarter-on-quarter comparison to a negative base in Q2.
In Q4, consumption tapered by $1 billion. Investment held constant. While the current account surplus also tapered by half a billion USDs. Swinging Q4 GDP growth into a contraction of -2.4 percentage points.
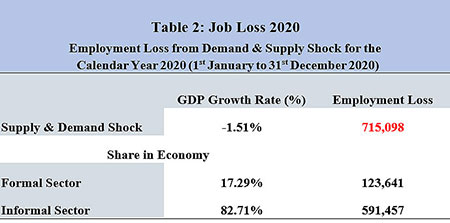
Job LossThe annualized growth rate of GDP for the calendar year 2020, of -1.5 percentage points, led to a net job loss of 0.7 million, as seen in Table 2 The major part of this loss in jobs and livelihoods was in the informal economy, with 0.6 million. The lesser part of the job loss was in the formal economy with 0.1 million.
GOP Economic Policy over 2020
The Covid 19 pandemic and shutdowns were looming in February 2020. GOP had two policy objectives. To generate growth. And to curb inflation raging at 12%-14%.
Monetary Policy StanceTo meet these twin objectives, GOP was confronted by the classic Flemming’s trilemma of:
(a) Controlling the inflation rate
(b) Controlling the interest rate to generate growth, and lower inflation.
(c) Controlling the exchange rate, to prevent import of inflation, and to improve the current account balance by raising exports and curbing imports
The policy instruments are the interest rate and exchange rate. Each has a tradeoff.
The interest rate needs to be lowered to raise investment and growth. But needs to be raised to curb inflation.
GOP chose wisely in this tradeoff. Reasoning correctly, that with the shutdowns, lost output, employment and income, inflation was not demand led but supply led. So GOP lowered interest rates. In Q1 from 13.75% to 12% (Table 3). Then in Q2 down to 8%. To generate growth.
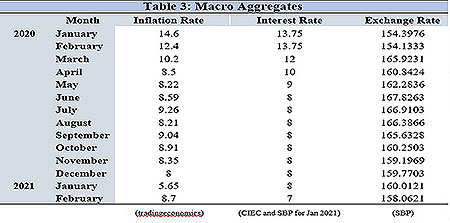
The second tradeoff is for the policy instrument of the exchange rate. The exchange rate has to be appreciated or kept constant to curb importing inflation. Especially to control rising energy bills, which lead to supply led, cost push inflation. But the exchange rate needs to be depreciated to improve the current account balance. Raising exports, and lowering imports.
GOP’s policy choice here has been more difficult. It has chosen to free the exchange rate, allowing it to depreciate from Rs 154 to the USD in January 2020, to Rs 160 by year end 2020 (Table 3).
This has had the unfortunate outcome of leaving inflation stubbornly high at about 8% per annum from Q2 to Q4. Nor has inflation been countered by the lowering of the interest rate.
So, GOP’s policy choice has clearly been to prioritize regeneration of plummeting growth. Perhaps curbing the contraction in GDP growth to -1.5%. At the expense of inflation.
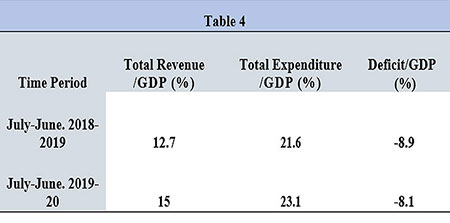
Fiscal Policy StanceGOP’s fiscal policy options were more limited for 2020. It had already run a very high budget deficit of -8.9% of GDP in fiscal year July 2018 – June 2019, as Table 4 shows. GOP’s EFF agreement with the IMF entailed a reduction in this deficit. Hence for the fiscal year July 2019 – June 2020, GOP lowered this deficit to -8.1%.
Albeit a higher revenue take in 2019-2020 allowed GOP to increase its expenditure from 21.6% of GDP in 2018-2019 to 23.1% of GDP in 2019-2020.
Estimated Impact of the Coronavirus Pandemic on Poverty Headcount, 2020
The Modeling Lab at the Lahore School’s Innovation and Technology Centre makes annual estimates of the poverty headcount ratio which measures the proportion of the total population living in extreme poverty i.e., per capita expenditures below the international $1.90 a day poverty line.
These poverty estimates are computed using various rounds of the Household Integrated Economic Survey (HIES) conducted by the Pakistan Bureau of Statistics (PBS). The internationally set $1.90/day poverty line helps to distinguish the poor from the nonpoor by comparing the daily per capita expenditure to the poverty line. Any person having a daily expenditure of greater than or equal to $1.90/day is considered nonpoor and any person failing to meet this daily requirement is deemed poor.
The Modeling Lab has computed three annual estimates of the poverty headcount ratio for Pakistan, given in Table 5, using the HIES datasets. The first is an estimate for 2016, the second is an estimate for 2019 and the third is an estimate for 2020 which incorporates the impact of the coronavirus pandemic i.e., the demand side and supply side shocks on the poverty headcount.
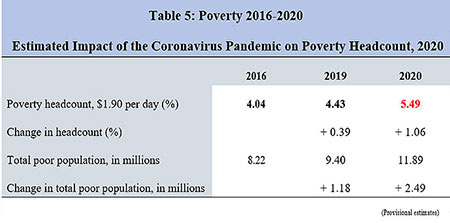
In 2016, the annual extreme poverty headcount ratio for 2016 is estimated at 4.04% percentage points of the total population i.e., more than 8 million people were trapped under extreme poverty in Pakistan.
In 2019, the annual extreme poverty headcount ratio is estimated at 4.43% percentage points of the total population; a surge in the percentage of extreme poverty from 2016. The poverty headcount has increased by 0.39% percentage points of the total population; an increase of approximately 1.2 million people over a span of three years.
In 2020, the annual extreme poverty headcount ratio is estimated at 5.49 % percentage points of the total population. This number is estimated by incorporating the impact of the pandemic induced supply side and demand side shocks to the incomes of the extreme poor in Pakistan. Our estimation shows that people faced a reduction of about 2% percentage points in their original incomes post COVID due to a drop in the value of GDP in 2019 from $276.11 billion to $271.95 billion in 2020. This pandemic driven loss in income and employment pushed the most vulnerable individuals clustered around the international poverty line of $1.90 a day into extreme poverty. Thus, increasing the percentage of the extremely poor in Pakistan by 1.06% percentage points of the total population from the baseline pre shock value of 4.43% of the total population in 2019 i.e., close to 2.5 million people in Pakistan were driven into extreme poverty due to the pandemic alone.
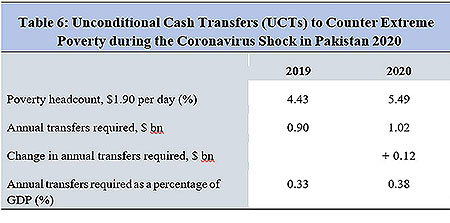
So, in order to cushion the impact of the pandemic on the poor, the poor must be compensated for the loss in income with the help of Unconditional Cash Transfers (UCTs). The target population of these cash transfers should not only be limited to the people that have been newly pushed into extreme poverty because of the pandemic i.e., 1.06% but should be targeted at the total poor population that is below the $1.90 a day poverty line i.e., 5.49% percentage points of the total population. Therefore, the recipients of the UCTs should consist of both the percentage of newly poor post-COVID (1.06%) plus the percentage of total population considered poor pre-COVID (4.43%).
Based on our estimation of the poverty gap, our estimates, given in Table 6, show that an annual transfer of $1.02 billion is needed to bring the total population of the extremely poor up to the poverty line.
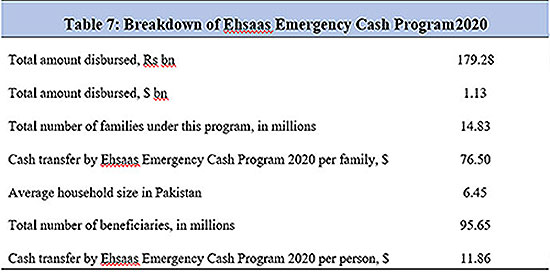
To provide relief to the most adversely affected by the COVID-19 crisis, the Government of Pakistan (GOP) introduced the Ehsaas Emergency Cash Program at the onset of the coronavirus pandemic last year. This program was designed to help approximately 15 million families in Pakistan during the span of the crisis and a total disbursement of cash transfers under this program has been of $1.13 billion to these families till date as shown by Table 7. The GOP, under this program, focused on providing financial assistance to both the poor and nonpoor during this crisis, but a transfer program that targets the extremely poor would be better as it targets the most vulnerable subgroup of the population.
Impact of the Coronavirus Pandemic on the Business Community in Pakistan
The Innovation and Technology Center (ITC) at the Lahore School of Economics conducts annual business confidence and export surveys by collecting data through telephone surveys from firms in major cities of Pakistan. These surveys help to provide understanding of the sentiments of the Pakistani business community in regards to the ongoing economic conditions each year.
Immediate, short run policy, to compensate for the lost income of the poor, has to be based on four normative principles.
The business confidence survey conducted in 2020 provides important insights related to how the businesses in Pakistan are trying to cope with the ongoing pandemic and how it has impacted their revenues, along with investment and employment decisions so far. The report highlights that more than 50% of the firms in the sample have experienced a contraction in their revenues and 53% of the firms confirmed a reduction in their levels of investment due to the pandemic induced demand side and supply side shocks. This loss in revenue and investment has led the firms to rethink their employment decisions for the year. Thus, causing them to use cost cutting strategies in order to curb their losses. Approximately 62% of the firms in the sample are planning to lay off close to one-fourth of their employees due to the pandemic-led financial distress.
On the other hand, the export survey conducted in 2020 highlights the situation of Pakistan’s export sector
and in particular, how covid-19 impacted their export value, volume along with the price and demand of their
exported product.
The report highlights that 75% of the exporting firms experienced a fall in their export volume but despite
this fall, more than 50% of the sample firms reported stagnant export values. The exporting firms did not
experience a change in their export values as falling export volumes were mostly compensated for by higher
unit prices as approximately 26% of exporting firms reported an increase in the average price per unit of
their exported good during the pandemic.
In addition to this, more than 80% of the exporting firms reported a loss in the global demand of their exported products due to the pandemic and this fall in demand impacted the sports goods sector the greatest, with almost 88% reporting a decrease in their product demand. Decreased demand and decreased export volume are a concern, though at the moment this has been balanced by higher prices of exported goods. So, while the value of Pakistani exports has not changed dramatically during the pandemic so far, falling global demand has the potential to hurt future Pakistani exports. Overall, the business community is struggling to keep their heads above water during this difficult time but they still seem quite hopeful regarding what the future holds for them.
Link to the Article in The Express Tribune