Department of Economics |
 People
| NEWS & MEDIA |
NEWS
Immediate policy options for countering the impact of the Coronavirus
Pandemic on Pakistan’s economy must focus on Poverty
June 20th 2020
Moazam Mahmood, Azam Chaudhry, Aimal Tanvir, Muaz
Chaudhry
Lahore School of Economics Modelling Lab
Innovation and Technology Centre
Lahore School of Economics
Quarter 1 2020 Estimates of loss in GDP and Employment
We have earlier estimated the impact of the Coronavirus pandemic on Pakistan’s GDP and employment. Using a General Equilibrium Macro (GEM) model for the Pakistan economy that the Modelling Lab Team at the Lahore School’s Innovation and Technology Centre has developed over the past two years for policy simulations and teaching. These estimates made in early May 2020 were modelled using a baseline of macro aggregates for Quarter 4 of 2019, observed for November to December of 2019. |
The availability of Quarter 1 2020, macro aggregates, for January to March, plus now April of 2020, requires a quarterly update. The Lahore School will now be doing these quarterly updates.
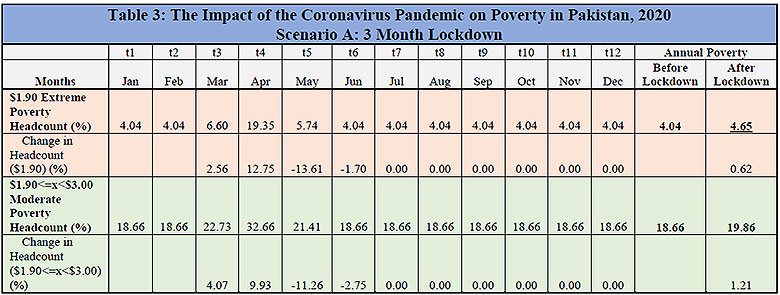
Table 1 gives a comparison of the estimated shocks on GDP growth between the previous Q4 2019 baseline estimates, and the revised Q1 2020 baseline estimates. Unfortunately, the observed values for January to April, raise the impact of the estimated shock.
For a three-month lockdown scenario, for March to May 2020, annual GDP growth for the calendar year 2020 is now expected to contract by 3.2% . Compared to our earlier estimate of a 2.9% contraction in GDP.
For a six-month lockdown scenario, for March to August, with a more prolonged and graduated easing in the lockdown over these six months, annual GDP growth is now expected to contract by 4.4%.Compared to our earlier estimate of a 3.1% contraction in GDP.
While for a nine-month lockdown scenario, for March to November, annual GDP growth is now expected to contract by 6.6%. Compared to our earlier estimate of a 5.5% contraction in GDP.
The elevated estimation of GDP losses, raise the estimated shock on job loss. Table 2 gives the Q1 2020 baseline estimates.
For a three-month lockdown scenario, annual job loss over 2020, is now estimated at 1.6 million. With the majority of 1.3 million jobs being lost in the informal economy, and 0.3 million in the formal economy.
For a six-month lockdown scenario, annual job loss over 2020, is now estimated at 2.2 million. With 1.8 million jobs lost in the informal economy, and 0.4 million jobs lost in the formal economy.
For a nine-month lockdown scenario, annual job loss over 2020, is now estimated at 3.4 million. With 2.8 million jobs lost in the informal economy, and 0.6 million jobs lost in the informal economy.
Policy to counter this loss in GDP and jobs
Policy to counter this loss in GDP and jobs, can be based on two notions. One, replacement of lost income. Two, restoration of lost capacity to produce this income. The immediate and short run need is to replace the lost income. Then follow the medium and long run needs of restoring production capacity. Of course, the two can, and should run concurrently. This policy note speaks to immediate policy for replacement of lost income. A policy note on macro policy to restore lost capacity follows.
Restoration of lost income, must also in a developing country like Pakistan, with an already lowered growth rate pre-Coronavirus, and beleaguered budgetary balances and Current Account (CA) balances, prioritize not income lost by everyone, but of the poor. Four percent of the population of 221 million fell below the internationally established extreme poverty line of $1.90, on last count. The job and income loss can be expected to swell this number. Immediate policy must begin by attempting to restore the incomes lost of these extremely poor. Therefore, policy must be predicated on an estimate of the increase in poverty in Pakistan, given the supply side and demand side shocks.
Estimates of the increase in poverty
Accordingly, we have estimated the impact of the loss in GDP and jobs, on two measures of poverty, the extremely poor falling under per capita expenditures of $1.90 per day, and moderately poor falling between per capita expenditures of $1.90 and $3.00 per day.
And based on our three scenarios for the duration of lockdown, of three months, six months, and nine months, over the calendar year 2020, adopted for estimating loss in GDP and jobs, our poverty estimates are again based on these three scenarios.
For the three-month lock down scenario, the annual extreme poverty headcount over the 12 months of the calendar year 2020, is estimated at 4.65% of the total population. Which is an increase in the headcount from its baseline pre shock value of 4.04% of the total population by 0.62% of the total population; this is an increase of approximately 1.4 million people.
Our monthly extreme poverty estimates for the 3-month lockdown scenario show that in the pre lockdown months for each of January and February 2020, extreme poverty is taken as the last empirically estimated headcount of 4.04%. Our General Equilibrium Model (GEM) then estimates the monthly impact of the lockdown shock, for the three months of the lockdown, March, April, and May. In March the extreme poverty headcount is estimated to rise to 6.6% of the total population. In April, during the peak of the pandemic-related lockdown, the extreme poverty headcount further increases to 19.35% of the total population. In May the extreme poverty headcount falls back to 5.74% of the total population. Assuming a three-month lockdown, in June the extreme poverty headcount returns to its pre-shock level of 4.04%.
For the six-month lock down scenario, the annual extreme poverty headcount over the calendar year 2020, is estimated at 4.93% of the total population. An increase in the head count from its baseline pre shock value of 4.04% of the total population, by 0.89% of the total population; this is an increase of approximately 2 million people.

For the nine-month lock down scenario, the annual extreme poverty headcount over the calendar year 2020, is estimated at 5.74% of the total population. An increase in the extreme poverty head count from its baseline pre shock value of 4.04% of the total population by 1.70% of the total population; this is an increase of approximately 3.7 million people.
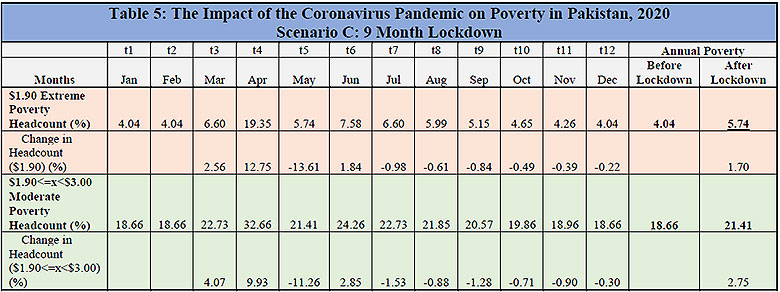
In our monthly extreme poverty estimates for a nine-month lockdown scenario, our model estimates again a peak in the extreme poverty headcount in April to 19.35% of the total population, compared to the baseline, pre shock, headcount of 4.04% of the total population for each of January and February. This headcount subsides even more gradually compared to the six-month scenario. The extreme poverty headcount is estimated at 5.74% of the total population in May, 7.58% in June, 6.60% in July, 5.99% in August, 5.15% in September, 4.65% in October, and 4.26% in November. Assuming a nine-month lockdown, with a gradual reduction after April, in each month, the headcount returns to its pre shock value of 4.04% of the total population in December.
Immediate Policy
Immediate, short run policy, to compensate for the lost income of the poor, has to be based on four normative principles.
One, it must be based on transfer incomes for the population that has fallen into extreme poverty at any time over this calendar year of 2020. These would be Unconditional Cash Transfers (UCTs) for 2020, to protect the most vulnerable population. A more sustainable Conditional Cash Transfer (CCT) can be phased in from 2021, of which more later.
Two, the size of the transfer per capita, is best estimated as the average value of monthly income lost over the calendar year 2020. Since monthly fluctuations in needs assessment will be nigh impossible.
Point three, there will be a tradeoff between the recipients’ micro view, and point four, the policy planner’s macro view.
From the point of view of the recipient population of the poor, it would be ethically discriminatory, to distinguish between the newly poor just pushed into poverty by the shock, and the chronically poor already below the poverty line prior to the shock. Therefore, any transfers will have to be aimed at the entire population of the poor post shock. That is say for the three-month scenario, given in Table 3, targeting the average of the shocked monthly headcount of 11.00%, rather than just the newly poor population. The headcount of the newly poor in any case fluctuates monthly, and will be nigh impossible to needs assess and identify.
But from the policy planners’ point of view, it is understandable if they wish to reverse initially, just the average monthly increase in poverty caused by the three -month shock, which is the just added 7% of the population. Rather than the chronically poor, 4.04% of the population, already poor prior to the shock.
Balancing points three and four, honoring the micro ethical, with the macro exigencies, becomes the cornerstone of our policy recommendation to GOP.
A blue print for transfers for the entire population of the poor post shock
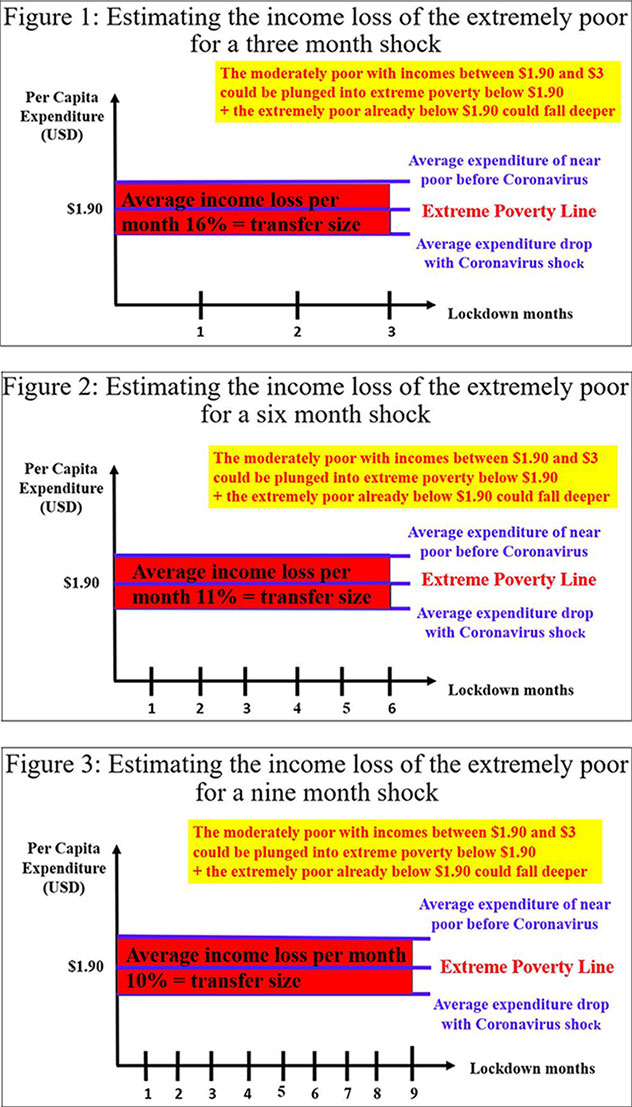
The quantum of the surge in poverty, the macro exigency, can be countered through self-selection. Our model estimates for the three-month lockdown, that the per capita expenditures of the population shocked into falling below $1.90, fell by 16%, as Figures 1-3 illustrate. Therefore, this is the quantum of transfers needed per capita to raise this population back above $1.90, and thereby counter the surge. Which approximates $0.30 per capita.
The micro ethical exigency, of not discriminating between the newly poor and the chronically poor, can be met by making this transfer of $0.30 per capita to the entire population of the poor at the height of the shock. Which is the average of the shocked monthly headcount of 11.00% of the population. Self-selection, will then automatically raise any poor person, newly shocked, or chronically poor prior the shock, above the $1.90 poverty line. Ethically those at the head of the income queue will get served first.
Also note that this criteria of transfers to the entire population of the poor, newly shocked and chronically poor prior to the shock, does meet the stricter ethical norm of protecting the poorest of the poor, whose incomes will also have been shocked, by raising the per capita expenditure of all of the poor, including them. Albeit temporarily, for the duration of the shock. A more macro sustainably strategy targeting the chronically poor, and the poorest of the poor, will have to be based on a CCT for 2021.
The quantum of the additional transfers to the extreme poor
The quantum of the additional transfers required for the extreme poor because of higher poverty resulting from the pandemic, come out to be:
Three-month scenario
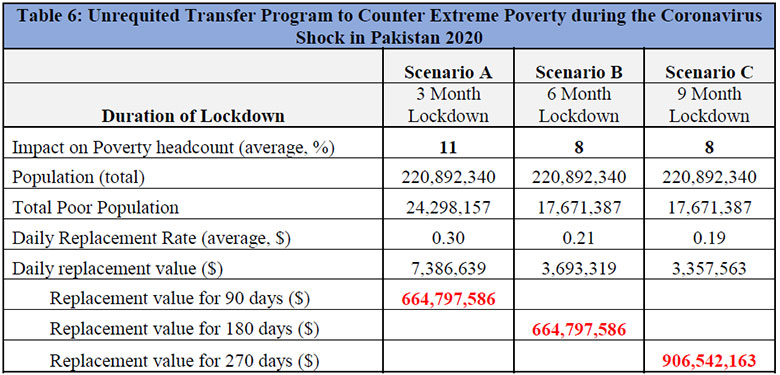
As Table 6 and Figure 1 show, an average monthly drop in per capita expenditure of 16%, for March to May, gives a replacement of lost income value for all three months of the shock. So daily per capita expenditure is assumed to drop by an average of $0.30 per month. This lost income has to be replaced for all the extremely poor falling below $1.90, now estimated by the model to be a monthly average of 11.00 % of the total population, which is 24.29 million for a 3-month period. This gives a daily income replacement bill for these 16.75 million extremely poor, at a daily per capita expenditure rate of $0.30, of $7.4 million. Replacing this lost income over the three-month shock, gives a total income replacement bill of $664.8 million.
Six-month scenario
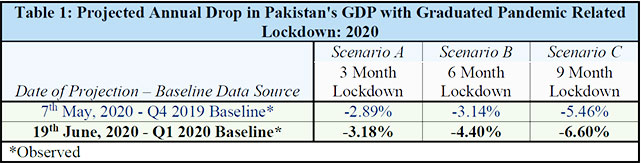
For a six-month scenario, as Table 4 recalls that the income loss is spread over a longer period compared to the three-month scenario. So, the parameters of the estimates of poverty change. So, for the six-month scenario, Table 6 and Figure 2 show, an average monthly drop in per capita expenditure of 12%, for March to August, gives a replacement of lost income value for all six months of the shock. So daily per capita expenditure is assumed to drop by an average of $0.21 per month. This lost income has to be replaced for all the extremely poor falling below $1.90, now estimated by the model to be a monthly average of 8.00 % of the total population, which is 17.67 million for 6-month period. This gives a daily income replacement bill for these 17.67 million extremely poor, at a daily per capita expenditure rate of $0.21, of $3.7 million. Replacing this lost income over the six-month shock, gives a total income replacement bill of $664.8 million.
Nine-month scenario
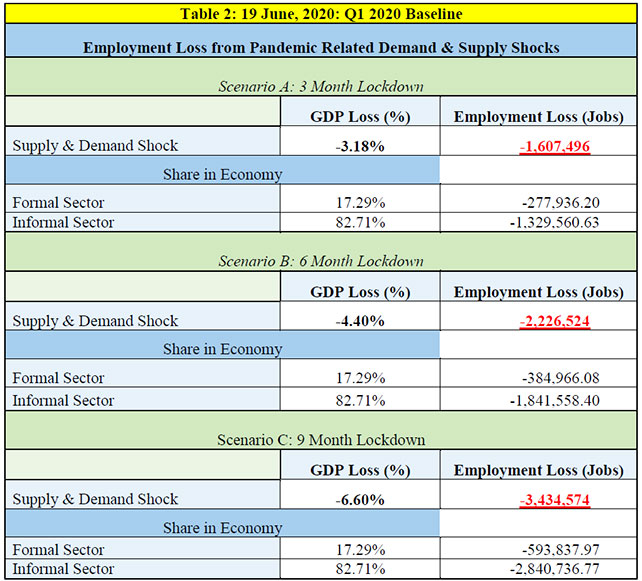
For a nine-month scenario, as Table 5 recalls that the income loss is spread over a longer period compared to the three- and six-month scenarios. So, the parameters of the estimates of poverty change. So, for the nine-month scenario, Table 6 and Figure 3 show, an average monthly drop in per capita expenditure of 9%, for March to November, gives a replacement of lost income value for all nine months of the shock. So daily per capita expenditure is assumed to drop by an average of $0.19 per month. This lost income has to be replaced for all the extremely poor falling below $1.90, now estimated by the model to be a monthly average of 8.00 % of the total population, which is 17.67 million for a 9-month period. This gives a daily income replacement bill for these 17.67 million extremely poor, at a daily per capita expenditure rate of $0.19, of $3.4 million. Replacing this lost income over the nine-month shock, gives a total income replacement bill of $906.5 million.