 | Department of Economics |
| NEWS & MEDIA |
NEWS
FACULTY DEVELOPMENT WORKSHOPS (SUMMER TERM 2018)
1. Session on Survey Questionnaire Design was conducted Dr. Kate Vyborny, Postdoctoral Associate, Department of Economics, Duke University
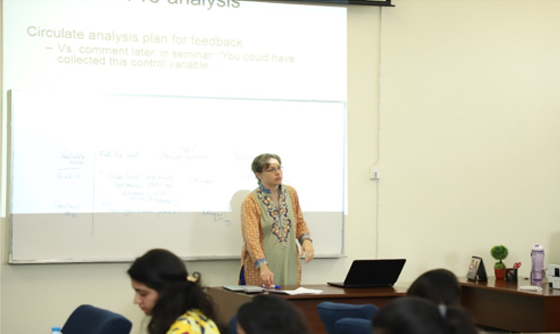
The session was conducted on 7th May, 2018 and included:
- Questionnaire design for quantitative surveys: An interactive session
A survey involves directly collecting information from people (or sometimes organizations) whom we are interested in. The types of information will take account of the people's or organizations' level of knowledge, attitude, personalities, beliefs, or preferences. Questionnaires are widely used to collect such information. Well-designed questionnaires are highly structured to allow the same types of information to be collected from a large number of people in the same way and for data to be analyzed quantitatively and systematically. Questionnaires are best used for collecting factual data and appropriate questionnaire design is essential to ensure that we obtain valid responses to our questions.
- Objectives in designing questionnaires
There are two main objectives in designing a questionnaire:
- To maximize the proportion of subjects answering our questionnaire-that is, the response rate.
- To obtain accurate relevant information for our survey. To maximize our response rate, we have to consider carefully how we administer the questionnaire, establish rapport, explain the purpose of the survey, and remind those who have not responded. The length of the questionnaire should be appropriate. In order to obtain accurate relevant information, we have to give some thought to what questions we ask, how we ask them, the order we ask them in, and the general layout of the questionnaire. This session details how to design and administer surveys.
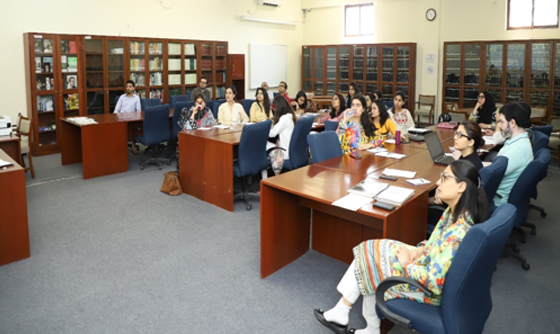
2. Session on Survey Questionnaire Design was conducted Dr. Kate Vyborny, Postdoctoral Associate, Department of Economics, Duke University
The session was conducted by Ms. Tania Hassan and Ms. Mehwish Jawad (Visiting Faculty Members, Lahore School of Economics). The session was conducted on 8th May, 2018 and the discussion covered:
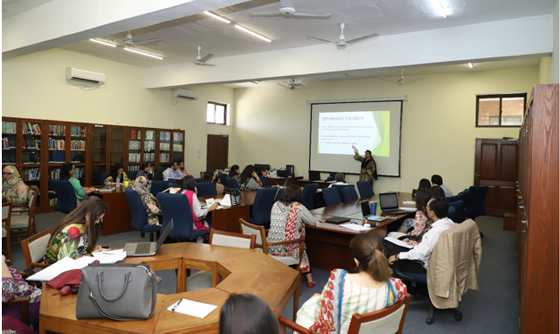
SmartPLS is a software with graphical user interface for variance-based structural equation modeling (SEM) using the partial least squares (PLS) path modeling method. Besides estimating path models with latent variables using the PLS-SEM algorithm, the software computes standard results assessment criteria (e.g., for the reflective and formative measurement models, the structural model, and the goodness of fit) and it supports additional statistical analyses (e.g., multi group etc). Since SmartPLS is programmed in Java, it can be executed and run on different computer operating systems such as Windows and Mac. This session explains how to use Smart PLS and guides users through worked examples.
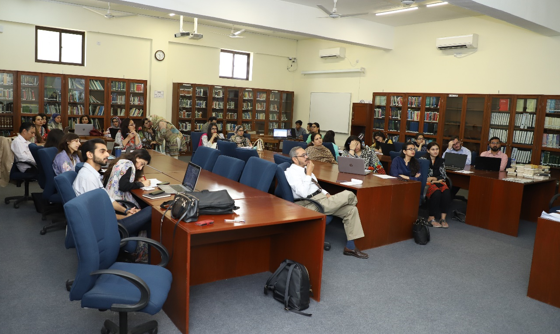
3. Hands-on Training with Turnitin
This session was conducted on 9th May, 2018 by Ms. Andleeb Nasib, Senior Librarian & Turnitin Administrator, Library and Documentation Centre, Lahore School of Economics.
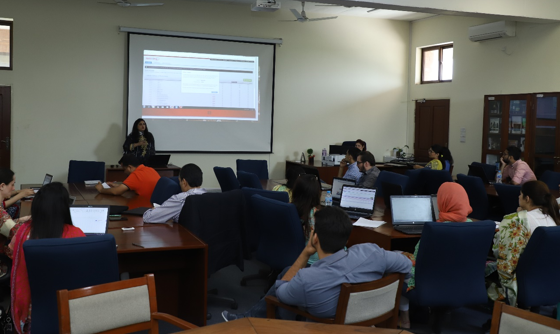
Turnitin is an internet-based plagiarism-detection service launched in 1997. The Pakistan HEC buys the license to use the software-as-a-service website, which checks submitted documents against its database and the content of other websites with the aim of identifying plagiarism. Turnitin has extensive resources to help instructors get started quickly and develop deeper skills through continued use.
Turnitin hands-on training was given to economics faculty, who were required to bring their own laptops and Wifi was also required. Faculty members were taught how to create their own turnitin accounts using their own LSE email IDs. Two sessions were held in the training workshop - faculty were taught how to use turnitin and were then guided through the process.
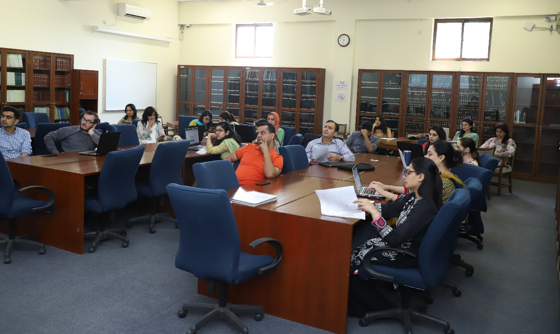
4. Using Microsoft Excel to Illustrate Economics Concepts
This session was on 10th May, 2018 by Mr. Umair Ayaz, Research Fellow, Lahore School of Economics.
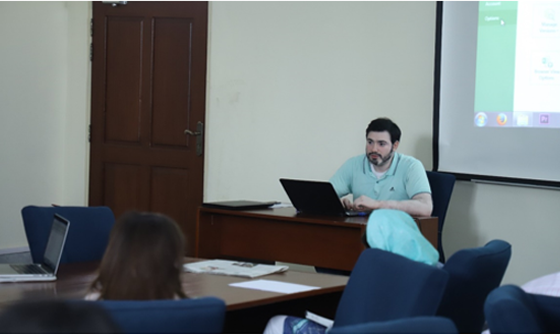
The session focused on using Microsoft Excel for illustrating some of the fundamental economics concepts to faculty using dynamic graphs. It was demonstrated how Excel can be used to obtain numerical solutions for simple economic models and graphically depict those as well as the changes resulting due to altering values of different parameters.
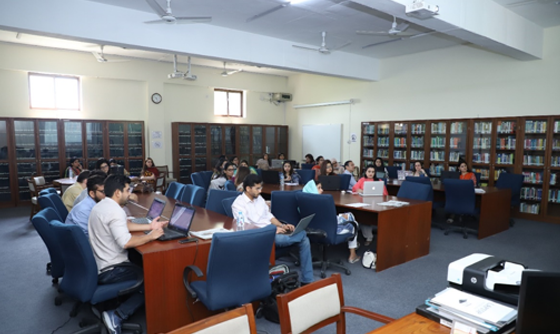
5. An Introduction to Qualitative Inquiry
The session was conducted on May 11th by Dr. Shehla Arifeen, Associate Professor, Business Administration, Lahore School of Economics.
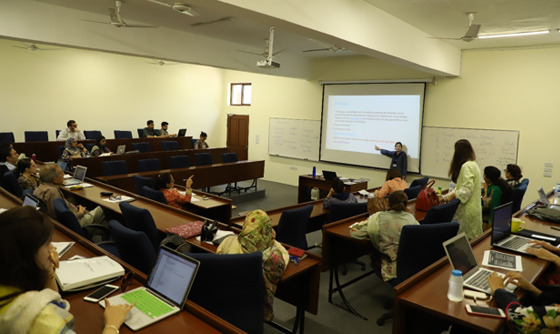
"Qualitative Research.involves finding out what people think, and how they feel - or at any rate, what they say they think and how they say they feel. This kind of information is subjective. It involves feelings and impressions, rather than numbers." - Bellenger, Bernhardt and Goldstucker, Qualitative Research in Marketing, American Marketing Association.
The session introduced participants to the different ontology, epistemology, theoretical frameworks, and research paradigms and the role of these in qualitative research.
 People